Barnet’s Cost of Living Data Explorer: A peek into the future of insight generation
The cost of living is a much-discussed topic due to its recent rise and impact on people across the UK. We were interested in exploring how this national situation had impacted the residents of our local authority – Barnet.
Specifically, we wanted to know:
- How much the cost of living had risen in Barnet, and specifically in what areas?
- Were incomes increasing to match this rise?
- What were the impacts of these changes in cost and income, and were they disproportionate to different groups of residents?
Designing the dashboard
To provide an answer to these questions, we decided upon making a publicly available PowerBI dashboard that would allow elected council members, council officers and Barnet residents alike explore a range of indicators that provide a holistic view about the cost of living. We wanted users to be able to tailor the data presented in the dashboard to their specific and varying interests. To achieve this, we selected measures related to the cost of living that could be broken down by sub-categories, such as by inflation category or type of house. Wherever possible we prioritised showing data at the borough or sub-borough level. However, we were limited by the geographic availability of some measures which were only available at the national or London level.
In terms of our design, we had three main priorities for this dashboard:
Priority #1: The dashboard was dynamic
We achieved this by implementing the use of time and sub-category filters to allow users to look at specific areas and trends of interest.
Priority #2: The dashboard was easy to use and interpret
We achieved this by separating indicators into three themes (Cost, Income, and Impact) and utilising the Enlightened Data Story visual in PowerBI along with DAX measures to give users specific analytical narratives to accompany the data.
Priority #3: The dashboard was up to date
We achieved this by building a reproducible data pipeline with Task Scheduler and Power Automate to allow for the automatic refresh of the data.
Keeping the dashboard updated
In our quest for consistently updated datasets, we employed two methods to streamline our data extraction, transformation and cleaning (ETL) processes.
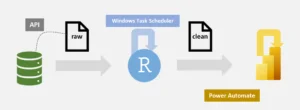
Our initial approach involved setting up automated pipelines to extract data via the APIs of the Department for Work and Pension’s (DWP) open data platform, STAT-XPLORE, and the Office for National Statistics’ (ONS) open data platform, NOMIS. Leveraging R scripts with Windows Task Scheduler, we scheduled regular executions to fetch data via API calls at specified intervals. Additionally, we scheduled the automatic refresh of PowerBI through Power Automate to ensure the dashboard would always present the latest available data.
Unfortunately, most of our chosen datasets lacked APIs, which posed another unique challenge. Our solution was to create an alternative automated data pipeline leveraging HTML parsing.
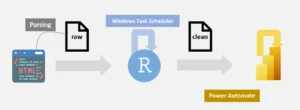
With this method, we targeted parsing through either the download links or the table bodies with headers from the web pages where datasets were hosted. The dynamic nature of links presented a challenge as filenames often changed from week to week. For example, a CSV file named “030124_data.csv” might be labelled as “100124_data.csv” in the following week. To address this variability, we implemented rules utilising regular expressions to accurately parse dynamically changing file links. Like our initial pipeline, both R scripts and PowerBI were scheduled for regular refreshes. This meticulous approach ensured that our pipeline remained updated, regardless of changes in data sources or file naming conventions.
With these automated data pipelines, we have established a robust framework for continuously updating our datasets, empowering us to make informed decisions based on the latest available information.
Into the future
Our final dashboard consists of 21 topics sorted into three themes: cost, income, and impact. Metadata and methodology pages bolster transparency in terms of data sources and indicator calculation.
We hope this Cost of Living Data Explorer will be a useful tool now and into the future as the cost of living continues to affect us all. This dashboard is currently available at Open Barnet and will be part of the ongoing refresh of our Joint Strategic Needs Assessment, allowing it to take its place amongst other pieces of analysis that bring together data from a range of sources to describe and give insight into Barnet and its residents.
James Rapkin
Hannah Chang
Olivia Cowie