Key Insights from LOTI’s Mapping Digital Exclusion Project
To tackle digital exclusion, local authorities must effectively understand the differing needs, drivers and barriers facing communities and individuals that are digitally excluded.
Five boroughs – Barnet, Brent, Kensington and Chelsea, Southwark and Westminster – have come together to work collaboratively through LOTI to develop resources that build a more detailed understanding of digital exclusion across London.
Those resources include a map of factors contributing to digital exclusion in London, a bank of personas of digitally excluded groups, and research into how digital exclusion affects them.
This blog sets out some of the key insights from this project, together with how you can use the resources it created.
1. Insights from the Map
Identify key groups
The map we developed is designed to help digital inclusion leads, VCS organisations and others to understand the geographic distribution of digital exclusion down to ward level. It includes open data sets which identify a relatively high concentration of people likely to be in one of five key groups most at risk of digital exclusion. The five key groups were identified through initial research completed at Westminster and validated across the other boroughs. They include:
- Older People
- Low-Income Families
- Unemployed
- Those with a disability
- Small and Micro Businesses
You can access the map here and begin to see which areas may have high concentrations of the key groups in a particular ward. This can help you identify the areas you might want to prioritise for digital inclusion interventions. By layering additional key group data sets onto the map, you can start to see where there might be a relatively higher proportion of the population with multiple needs.
In the example below, you can see wards in North Kensington that have a higher proportion of both people with a disability and older people.
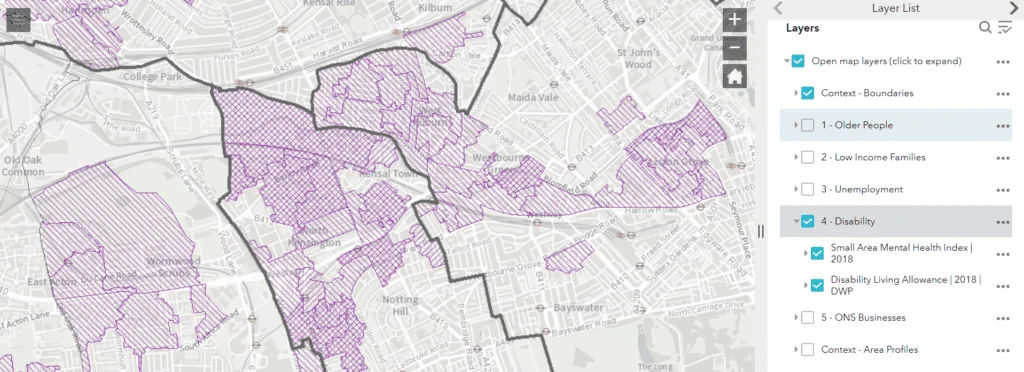
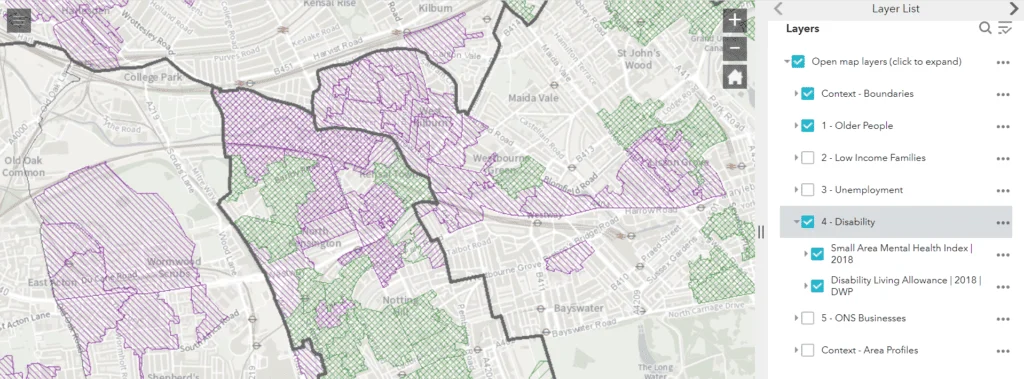
In these areas, you might want to consider how multiple needs intersect and what interventions are desirable. The Digital Inclusion Persona pack (see below) explains how you can centre your interventions on user needs.
Combining with Local Data
Richer insights can be developed by combining the mapped data sets above with others held locally. For example, Westminster has combined open data on the key groups with commercial data (Acorn Data set) and the Low Incomes Families Tracker (LIFT) to provide a more granular analysis at street level. Due to the sensitivity of this type of analysis, they are not for publication and a Data Privacy Impact Assessment (DPIA) should be completed before carrying out any personally identifiable analysis.
Follow the instructions in the Digital Exclusion Mapping Toolkit for details on how to access the open data on the five key groups as geo packages and geo databases, and for our full methodology.
2. User personas
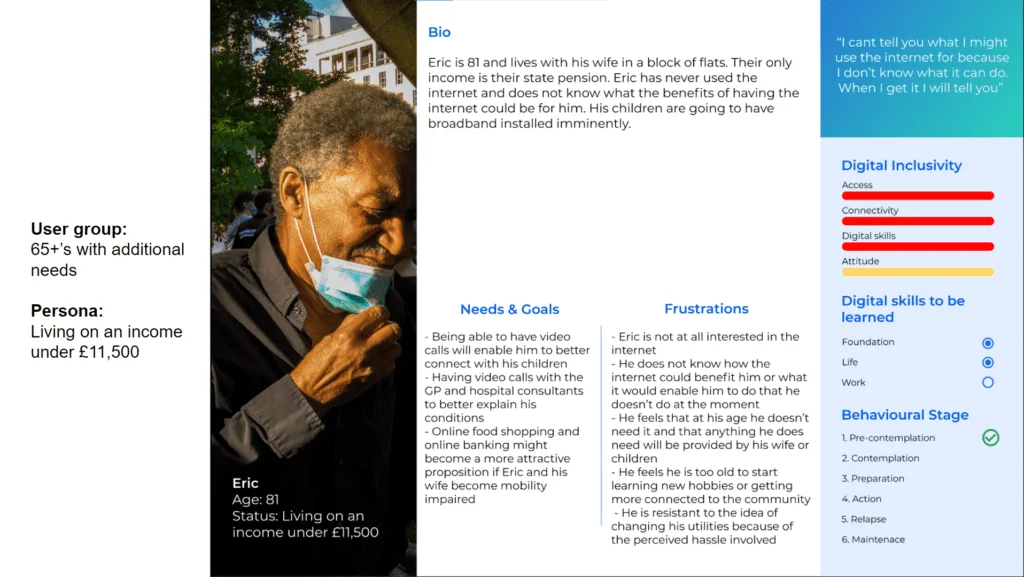
Personas are a tool for designing services based on user needs. The pack of 24 personas enables you to understand the needs, experiences and factors leading to digital exclusion from a person-centred perspective. Personas are archetypes and a design guide but are based on research carried out and validated across the five borough partners. Boroughs may want to carry out a validation exercise in their own area using the guidance and templates in the toolkit.
Using the Personas
Personas can be used alongside insights from the map to help design support and interventions. For example, if you have identified an area with a larger than average number of deprived older people you could use the personas of ‘Eric’ ‘Mary’ and ‘Harold’ to inform your service design.
Combining the map and personas enables you to design the right intervention in the places where they are needed (place-based intervention).
3. Insights from quantitative and qualitative research
To gain a deeper understanding of the nuances of digital exclusion, face-to-face surveys were undertaken with 850 residents across Westminster and Kensington & Chelsea. The data from those surveys has validated a number of insights that are likely to be familiar to those working in digital exclusion but that are now supported by a more robust evidence base.
Headline Insights into digital exclusion
- The most significant barriers identified included: lack of interest, confidence and skills. 64% of non-internet users said they have no interest in using the internet, and that nothing would persuade them.
- Just 1 in 10 non-internet users said a free device would most likely encourage them to use the internet in the future.
- Across the top four key groups, social activities were the most important perceived benefit of accessing the internet.
- Unemployed respondents were more likely than average to access the internet in a library, community centre or public place.
- 40% of respondents said they’d prefer to receive help from friends and family to improve their confidence and skills, but more than 9 in 10 (91%) had no children living in their household.
This data highlights that simply creating a supply of devices and data will not be enough for many people who are currently digitally excluded. It points to the need to design projects around the interests of those in your key groups, not around the digital service you may want them to engage with!
Full data from the survey and additional information on the methodology will be made available as part of the Mapping Digital Exclusion Toolkit.
Next Steps
Segmentation
Westminster is working on segmentation analysis of the data from the face-to-face survey responses of residents across Westminster and RBKC. This will define groups of people with similar characteristics, attitudes and behaviours. For example ‘Not for me’ and ‘Reliant on others’ – those who have overtly expressed a disinterest in learning digital skills. These segmentation insights will be used to inform further strategic development of targeted and tailored interventions at Westminster and as part of LOTI’s Digital Inclusion Innovation Programme (DIIP).
Pan London Story Map(s)
To make insights from the map more accessible to a wider audience, we are developing ‘story maps’ for each of the five key groups. The story map allows us to present a combination of quantitative data sets overlaid with qualitative insights and analysis together with a narrative story. This can lead an audience from initial findings to deep insights through to strategy and interventions.
Starting with the digitally excluded ‘over 65s’ and ‘over 75s with low digital confidence’, the project group will develop a map with more detailed and specific analysis for these groups. For example, we will select the most relevant data sets to overlay and set thresholds and transparencies to make it easy for users to read and interpret the data presented. Accompanying analysis and additional data sets will be included as part of this work before being tested with boroughs and VCS partners.
How to get involved
Testing the Story Map: We are looking for borough and VCS organisations to test our analysis and recommendations for ‘the over 65s’ Story Map. If you or your team are interested in using the Story Map to support your work in this area, please contact Jay Saggar.
Jay Saggar